Introduction
If you didn’t read the articles on logs and pg_stat_statements this article is based on a talk that I did at the pgdayParis and here are the slides. You can watch the Djangocon Europe 2017 version, it’s more django developer oriented, which can be interesting if you’re using django’s ORM. And here is the video from the PGdayParis.
If you want to test the queries, here is the github project for the talk. You can find a dump of the database, and the SQL using generate_series to fill the DB.
Let’s say you have a slow query, if you’ve never had this problem, a few advices:
- close this page, it’s useless
- start working a bit, if you’ve never written any stupid code, what are you doing ?
So, back to our slow query, what you would want is understand why it’s slow, so basicaly “what the hell is postgres doing?”. To do that, we are going to look into the query plan.
What is a query plan?
You’re wondering what I’m talking about? Well let’s start at the begining of the story, you are sending a query to your DB server and you get a result. Like this
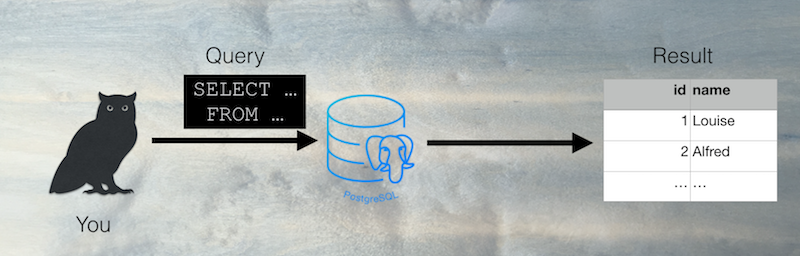
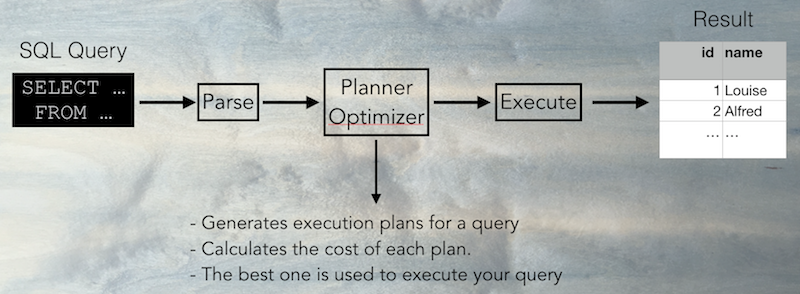
What is happening there ?
- First the query is parsed into a query tree (an internal data structure). The syntax errors are detected.
- Then the planner and optimizer generates query plans (ways to execute the query) and calculate the cost of this plans.
- The best query plan is executed and then the results are returned to you.
About EXPLAIN
EXPLAIN is the command that gives you the query plan used for a given query. By using it, you will know how the query is executed and it can help you understand why it is slow.
To use EXPLAIN, take a query and run
EXPLAIN (ANALYZE) your_query;
If you use ANALYZE, your query will be executed, without it you get only the query plan with the estimated costs.
If you want to add the ANALYZE option on an UPDATE or DELETE, you can rollback
BEGIN;
EXPLAIN ANALYZE my_query;
ROLLBACK
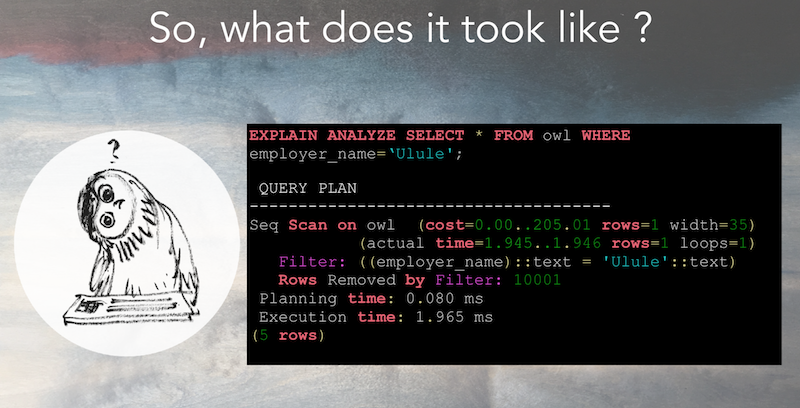
You will get a result that will look like this:
What are costs and actual times ?
Costs
The costs are calculated using database statistics. They look like this :
(cost=0.00..205.01 rows=1 width=35)
- The part
cost=0.00..205.01has two numbers, the first one indicates the cost of retrieving the first row, and the second one, the estimated cost of retrieving all the rows. You might wonder why the first cost is 0.00 and the second one 205.01. If there is only one row, why are the numbers not the same ? It’s because it is using a sequential scan (explained in this article, the cost of reading the first row of the table is 0, but the cost of retrieving the one matching theWHEREclause is higher. It’s like with a book, reading the first line of it costs you nothing, but reading the block that interests you is a bit more “expensive”. rows=1is the estimated number of rows returned in your resultwidth=35is the average size of a row in kB.
If you’re using EXPLAIN without ANALYZE and the rows seem really of from the reality, you can force postgres to collect statistics on a table by running.
ANALYZE my_table;
Actual times
The actual time is only displayed if you are using ANALYZE.
(actual time=1.945..1.946 rows=1 loops=1) means that the seq scan was executed once (loops=1), retrieved one row rows=1 and took 1.946ms.
Be careful about the loops, if the scan takes 5ms but is executed 1000 times in a loop, it can be the reason of a slow query !
Conclusion
Now it’s time to understand the different scans used by postgreSQL. I mentionned the sequential scan (seq scan), the next article focuses on that.